Chat Here

Add My Banner!!

SSSTOCK

- Friends Link -

Promote Your Blog

Friday, August 28, 2009

How to detect Stock Market Trend

In the preceding section, we saw how support and resistance levels can be penetrated by a change in investor expectations (which results in shifts of the supply/demand lines). This type of a change is often abrupt and "news based."

In this section, we'll review "trends." A trend represents a consistent change in prices (i.e., a change in investor expectations). Trends differ from support/resistance levels in that trends represent change, whereas support/resistance levels represent barriers to change.


uptrend
Picture 1


As shown in Picture 1, a rising trend is defined by successively higher low-prices. A rising trend can be thought of as a rising support level--the bulls are in control and are pushing prices higher.


downtrend
Picture 2


Picture 2 shows a falling trend. A falling trend is defined by successively lower high-prices. A falling trend can be thought of as a falling resistance level--the bears are in control and are pushing prices lower.
Read More....

Tuesday, August 25, 2009

A BIGG CUPPPPPPPPP

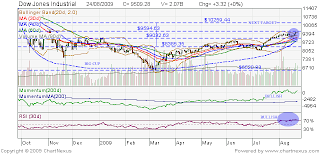
TECHNICAL ANALYSIS for DOW JONES INDUSTRIAL

BULLISH!!!

1.WATCHOUT when DOW break 9594, ITS BULL TIME, no time for COME BACK DOWN!!! NEXT target will be 10259.

2.CREATE A BIG CUP!!!!

3.MA ( Moving Average )30 and MA40 already crossed by candlestick from top to bottom.

4.Looks momentum line 200 day move above momentum MA200

5.RSI(Relative Strength Index) line moves ABOVE 70%.

Becarefull within two days, stock will decline for profit take!!

1.CCI20 days move below 100.

2.Bollinger band getting TIGHT!

MY SUGGESTION DO NOT BUY ANYTHING UNTIL INDEX GOING RED!!!


Read More....

Tuesday, August 18, 2009

My Portfolio 23-07-09

SORRY LATE for update my BLOG. My computer memory was broken fiuhhhh!! But at 20 june 09 I already told you The Stocks you MUST BUY!! Check here!!!


My money RP 18.338.585

I calculate the commission at the time of selling shares
Total commission for buy and sell stock is 0,7%

My Stocks
NULL

BUY ANTM (Aneka Tambang Tbk) STOCK, 22 JUNI 09
10 Lots at price 1960=10 x 500 x 1960 = 9.800.000

BUY TINS (Timah Tbk) STOCK, 23 JUNI 09
8 Lots at price 2050=8 x 500 x 2050 = 8.200.000

MY STOCK NOW
ANTM 10 lots at price 1960

TINS 8 lots at price 2050

MY MONEY NOW RP 338.585


DO NOT WORRY MARKET IN BULL

Read More....

My Portfolio 20-07-09

Friday, 17 June Two BOMBS HAVE been EXPLODED at Hotel JW MARIOT and Hotel Ritz Carlton Jakarta(Indonesia). I’m very panicked so I thought to sell all my stocks to stay calm and see what TREND will lead this week!! I’m afraid because of that foreign investors will take out their money from Indonesia market!!

Foreign Market ExchangeS show BULL TREND and oil going up to 64$! GOOD NEWS!!

My money RP 12.837.125

I calculate the commission at the time of selling shares
Total commission for buy and sell stock is 0,7%

My Stocks
ANTM (Aneka Tambang Tbk) 6 lots at price 2025
TINS (Timah Tbk) 6 lots at price 1880

SELL TINS (TIMAH Tbk) STOCK
6 Lots at price 1840=6 x 500 x 1840 = 5.520.000-(0.007*5.520.000)= 5.481.360

SELL ANTM (Aneka Tambang Tbk) STOCK
6 Lots at price 1900=6 x 500 x 1900 = 5.700.000-(0.007*5.700.000)= 5.660.100

MY STOCK NOW
NULLL

MY MONEY NOW RP 18.338.585

For the SAVES

FIRST BUY, if candlestick move below Midle Bollinger Band 20 days

SECOND BUY,I will buy stocks if they MOVE into MOVING AVERAGE 30 DAYS!

1.ANTM 1980,2060

2.TINS 1976,2060

3.BUMI 1960 Read More....

My Portfolio 16-07-09

LOOK DOW JONES INDUSTRIAL, its going UP and UP!!

Fundamental

1.GM has been SAVED by The Government!!

2.California receive Bailout!!

3.JP Morgan profit Climb!!

4.Oil still above 60$

5.Etc ( http://www.bloomberg.com )


Technical


Dow Jones Industrial Chart


1.THREE BIG GREEN CANDLESTICK

2.Just need ONE DAY to BREAK UP Moving Average 30 days, MA40, MA60, and Middle bollinger band!

3.Commodity Channel Index already moved above 0 line!

4.Relative Strength Index touch 50% line, will be break up if dow is GREEN AGAIN!

Because DOW JONES IS BULL I thought BUY before its too late!!

You can buy some stocks that I recommend below:

ANTM 1940

TINS 1880

BUMI 1940

INCO 3850

UNSP 700


My money RP 12.837.125

I calculate the commission at the time of selling shares
Total commission for buy and sell stock is 0,7%

My Stocks
ANTM (Aneka Tambang Tbk) 6 lots at price 2025

BUY TINS (TIMAH Tbk) STOCK
6 Lots at price 1880=6 x 500 x 1880 = 5.640.000

MY STOCK NOW
ANTM (Aneka Tambang Tbk) 6 lots at price 2025
TINS (Timah Tbk) 6 lots at price 1880

MY MONEY NOW RP 7.197.125

Read More....

My Portfolio 02-07-09


Keep your money at least 50% from your total portfolio. Be careful THE VOLUME IS VERY VERY LOW!!!! If you want, hold it till 8 July 2009 (President Election), hopefully foreign money will come again in THIS MARKET!!! I am still keep my ANTM stocks till The FIRST Indonesian man election!!


TINS CHART


Why I SOLD TINS

MINUS

1.candlestick below MA30, MA40, and MID BOLLINGER BAND

2.Commodity Channel Index still below 0 line!!

3. VOLUME VEY LOW!!

PLUS (Still good for year INVESTMENT)

1.Candlestick still above MA200

2.MOMENTUM 200 DAYS still below momentumMA200days

3.Relative strength index still above 50%

THE BAD NEWS IS THE WORLD STOCKS EXCHANGE ARE IN THE SIDEWAYS POSITION!!!

My money RP 2.534.750

I calculate the commission at the time of selling shares
Total commission for buy and sell stock is 0,7%

My Stocks
TINS (TINS Tbk) 10 lots at price 1990

ANTM (Aneka Tambang Tbk) 6 lots at price 2025

SELL TINS (TIMAH Tbk) STOCK
10 Lots at price 2075=10 x 500 x 2025 = 10.375.000 –(0.007 x 10.375.000)= 10.302.375

MY STOCK NOW
ANTM (Aneka Tambang Tbk) 6 lots at price 2025

MY MONEY NOW RP 12.837.125
Read More....

My Portfolio 25-06-09

AS MY PROMISE YESTERDAY check here "IF tomorrow(25 june 09) ANTM cross MA30 line I will buy again"

My money RP 8.609.750

I calculate the commission at the time of selling shares
Total commission for buy and sell stock is 0,7%


My Stocks

TINS (TINS Tbk) 10 lots at price 1990

BUY ANTM (ANTM Tbk) STOCK
6 Lots at price 2025=6 x 500 x 2025 = 6.075.000

MY STOCK NOW
TINS (Timah Tbk) 10 lots at price 1990

ANTM (Aneka Tambang Tbk) 6 lots at price 2025

MY MONEY NOW RP 2.534.750


My suggestion BUY again broo or you will to late for buy now its the time to BUY!!!
Read More....

My Portfolio 24-06-09

I bought TINS again with 60% money!! After break the CUP down its getting UP again cross the Moving Average 40 line and Relative Strength Index 30 days still calm!!

IF tomorrow ANTM cross MA30 line I will buy again!! THX BRO HAPPY GAIN THERE IS NO BIG BEAR ONLY little one!!


My money RP 18.559.750

I calculate the commission at the time of selling shares
Total commission for buy and sell stock is 0,7%

My Stocks
NULL

BUY TINS (TINS Tbk) STOCK
10 Lots at price 1990=10 x 500 x 1990 = 9.950.000

MY STOCK NOW
TINS (TINS Tbk) 10 lots at price 1990

MY MONEY NOW RP 8.609.750

Read More....

My portfolio 23-06-09

My money RP 10.248.340

I calculate the commission at the time of selling shares
Total commission for buy and sell stock is 0,7%

My Stocks
ANTM (Aneka Tambang Tbk) 5 lots at price 1070

ANTM (Aneka Tambang Tbk) 4 lots at price 1280

SELL ANTM (Timah Tbk) STOCK
9 Lots at price 1860=9 x 500 x 1860 = 8.370.000-(0.007*8.370.000)= 8.311.410

MY STOCK NOW
NULLL

MY MONEY NOW RP 18.559.750

ANTM picture

ANTM chart
Why I SELL ANTM??? Its already BEAR

CUP has been broken down by Candlestick at 1980 point!!! Next target CUP WITH HANDLE at 1694 point. Looks the volume it getting low and lower!! Indonesia Stock Exchange (IHSG) chart already moved below MA 30 line!!

IT IS NOT GOOD ANYMORE ITS BEAR

1.Indonesia Stock Exchange (IHSG) broke its STRONG SUPPORT (MOVING VAREGAE 30)

2.RSI (Relative Strength Index) at 50% line!!

3.Commodity Channel Index above under 0.

4.Candlestick reach lower line of BOLLINGER BAND!!


WARNING!!

JUST WAIT N SEE!! I suggest to sell all your stock, or least you hold 50% money from your portfolio!! Becareful Dow Jones is in BEAR position!! Read More....

My Portfolio 21-06-09

WANTS TO KNOW MY PORTFOLIO BEFORE THIS CHECK HERE SSSTOCK

My money RP 194.215

I calculate the commission at the time of selling shares
Total commission for buy and sell stock is 0,7%

My Stocks
ANTM (Aneka Tambang Tbk) 5 lots at price 1070

ANTM (Aneka Tambang Tbk) 4 lots at price 1280

SMCB (Semen Cibinong Tbk) 10 lots at price 620

TINS (Timah Tbk) 5 lots at price 1220

SELL TINS (Timah Tbk) STOCK
5 Lots at price 2050=5 x 500 x 2050 = 5.125.000-(0.007*5.125.000)= 5.089.125

SELL SMCB (Semen Cibinong) STOCK
10 Lots at price 1000=10 x 500 x 1000 = 5.000.000-(0.007*5.000.000)= 4.965.000

MY STOCK NOW
ANTM (Aneka Tambang Tbk) 5 lots at price 1070

ANTM (Aneka Tambang Tbk) 4 lots at price 1280


MY MONEY NOW RP 10.248.340

ANTM PICTURE

TINS

TINS PICTURE

ANTM

Why I SELL TINS AND SMCB

Look Carefully the picture please!! Sees The Candlestick with round at two picture. Antm picture has red candlestick below MA30 and TINS has green candlestick below MA30 (SMCB has the same condition with TINS). My ANTM condition is undervalue that TINS and SMCB. Because of that I sold TINS and SMCB and wait at Monday(22 June 08), if ANTM go green I will buy again. ANTM condition is undervalue than TINS and SMCB!

Another FACT (IHSG) :
1.Indonesia Stock Exchange (IHSG) in BULLISH POSITION

2.RSI (Relative Strength Index) above 50% line!!

3.Commodity Channel Index above 0.

4.Bollinger Band upper line hit TWICE!!


BECAUSE ALL SECTOR IN IHSG go towards BULL and go PULLBACK You can buy more at Monday!!

Read More....

SORRY UNDER CONSTRUCTION!!
NOW MOVE TO
SSSTOCK Read More....