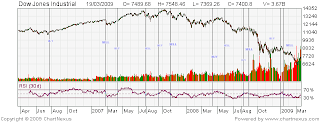
Relative Strength Index has overbought and oversold line. If RSI line over 70% it calls overbought, RSI line under 30% it calls oversold. Watch if RSI line cross up 50% line its BULLISH trend, when RSI line cross down 50% line its BEARISH trend.
How to calculated Relative Strength Index? I use 30 days period. First, calculate the sum total gain price and divided by 30 it call Average gain. Second, calculate the sum total loss price and divided by 30, it call Average loss. Then divide average gain by average loss that’s RELATIVE STRENGTH INDEX. When average gain better that average loss RSI line will increase!!
Buy and Sell signal. You are day trader try to use 7 days period, when RSI line cross up 30% buy it when reach 70% sell your stock and wait till back 30% line. You are investor use 30 – 60 days period, buy stock if RSI line cross upside 50% line, sell it if cross downside 50% line!! Look Picture below:


0 Comments:
Post a Comment